Article Category Archives: industry

The energy matrices of Brazil, the United States and China, their vectors and environmental impact

Something about the United Nations Framework Convention on Climate Change (UNFCCC) at the 21st Conference of the Parties (COP 21) in Paris, in December 2016

To begin with, there is no consensus on what causes global warming, although most scientists understand the anthropogenic importance of this issue. Taking that into account, I will make a brief comment.

The point

Scientists at the United Nations Intergovernmental Panel on Climate Change (IPCC), who advocate the idea of global warming with strong anthropogenic influence, have made it clear that some impact of climate change is inevitable, but there is still time to protect humanity from some of the most disastrous consequences. This reaction should come as part of a rapid shift in global strategies to avoid significant carbon dioxide (CO2) emissions.

The counterpoint

Critics, on the other hand, argue that models have mathematical failures and that external factors not taken into account could be altering the positions upward. Critics contend that climate simulations are unable to model particle cooler effects, to adjust water vapor feedback and to account for the role of clouds. Critics also argue, contrary to what is accepted by most of the scientific community, that the Sun may have a greater share of responsibility for the global warming currently observed. Some indirect solar effects may be very important and may not be taken into account by models. Thus, the share of the global warming caused by human action could be smaller than what is currently thought.

The tangency point

However, both sides of the scientific community agree that global temperature has risen by one degree since late nineteenth century, that atmospheric CO2 levels have risen by about 30% over the same period and that this trend may contribute to a future increase in global warming.

The results obtained by COP 21

 Overall, the COP 21 results confirm their claims. Among the 195 participating countries, the main emitters of CO2 are China, the United States of America[1], the European Union, India and Brazil (mainly due to the deforestation of the Amazon rainforest), which have committed themselves to work to keep the warming process below 2 ºC, seeking to limit it to 1,5 ºC until the end of the 21st century. For this purpose, rich countries must secure an initial funding of US$100 billion per year from 2020 to 2025, and, in this case, the exit of the United States would be a problem. The COP 21 does not mention the percentage of greenhouse gas emissions cut needed to reach the targets or when emissions need to stop rising. On the other hand, from 2018 on, the agreement should be reviewed every five years, when the COP 21 work should be adjusted and the emission cuts, suggested.

 The energy matrices of China, the United States, Brazil and the Organization for Economic Co-operation and Development (OECD)

From the point of view of the classical energy balance, which encompasses the trajectory that starts at the primary availability until it reaches the final demand, passing through the transformation centers, we can count on the work of the International Energy Agency (IEA), in which the balance sheets of the world, from each country and by blocks of countries, from 1971 to 2014, appear within the same methodological standard published in their graphic and traditional form. By adding the useful energy to the classical balance, we open ways to measure the efficiency of energy by activity sector and by energy source as well as by the matrix itself, under the forms of mechanical energy, process heat, direct heating, chemistry, refrigeration or lighting. For this reason, China stands out, both for its magnitude and economic strength and for the contribution of texts found in the literature, in particular the work of Paul Edward Brockway et al. (2015) Understanding China’s past and future energy demand: an exergy efficiency and decomposition analysis. In this study, the authors work with the concept of exergy[2], also tackling that of useful energy, which can be summarized in a table specifically developed by the authors, in which useful energy was considered in details under its thermal, mechanical, electrical and muscular forms. In 1971, the aggregate exergetic efficiency totaled 5.3%, relating useful energy to primary exergy; in 2010, this ratio reached 12.5%. In the Sankey diagram, the authors also place primary energy in its   conventional form, according to the IEA criteria, along with the primary exergy, which will allow a comparison with the efficiencies of the selected countries, including China itself, Brazil (and Rio Grande do Sul) and the United States. In 1971, in China, the aggregate efficiency was 9.6% and, in 2010, 15.7%. In other words, in the Asian country, of everything that counts as primary availability in the energy system, only 15.7% is used. In 2014, this rate was 33.4% for Rio Grande do Sul and 45.6% for Brazil. In 2015, it was 39.4% for the United States. Regarding the indicator of efficiency for the electric sector, we have 52.0% for RS, 62.0% for Brazil and 33.7% for the United States. Increasing losses are related to the use of much lower efficiency coal. It is noted that China has a low efficiency matrix[3]. Considering the size of the country’s economy and its high development rates, we can imagine the impact on the environment and on natural resources. On the exergetic side, in 2010, its losses reached 87.7% of the primary availability.

Opening up the discussion a little more — considering especially national energy matrices due to the large hydric share in the generation of electricity —, alongside the electric sector itself, yields are 53.6% for Rio Grande do Sul, 62.0% for Brazil and 33.2% for the United States, which use mainly coal.

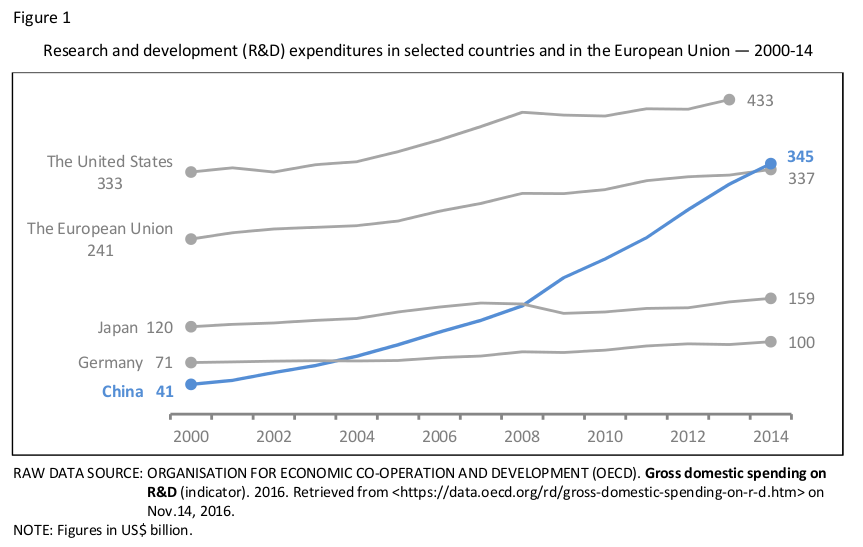
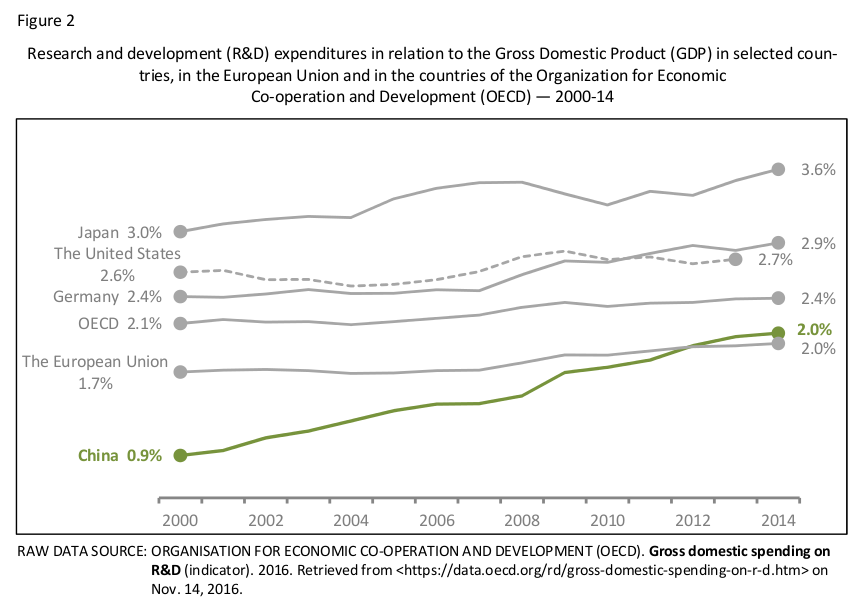
Figures 1 and 2, which refer to 2014, highlight China, the United States and Brazil in terms of total final consumption and total primary energy supply (TPES), including their main energy vectors. For comparison purposes, countries such as Russia and India are introduced, as well as the OECD and Asia, except for China.


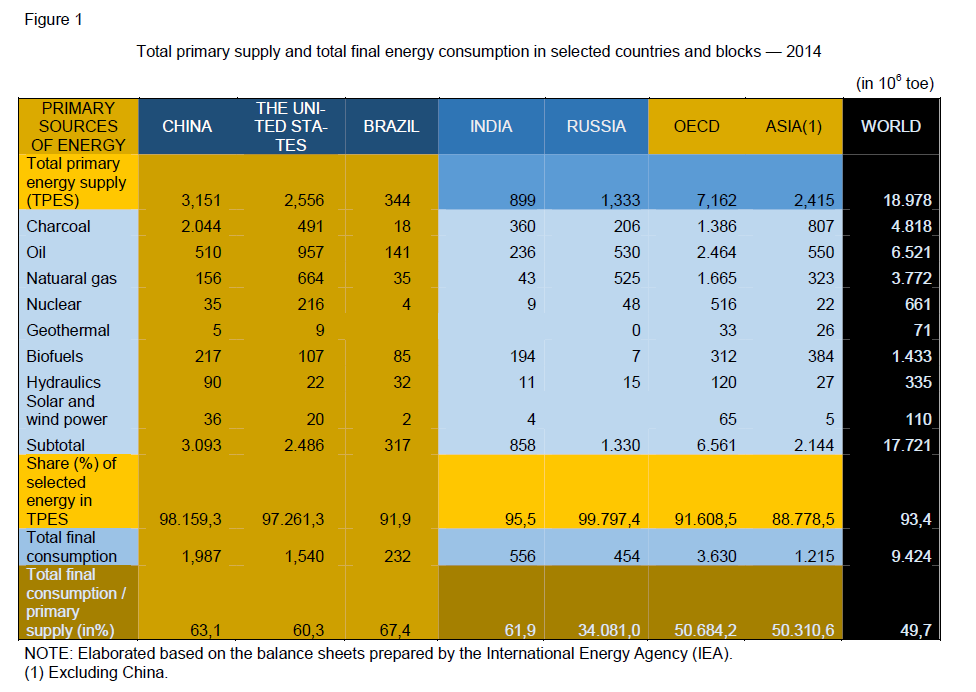
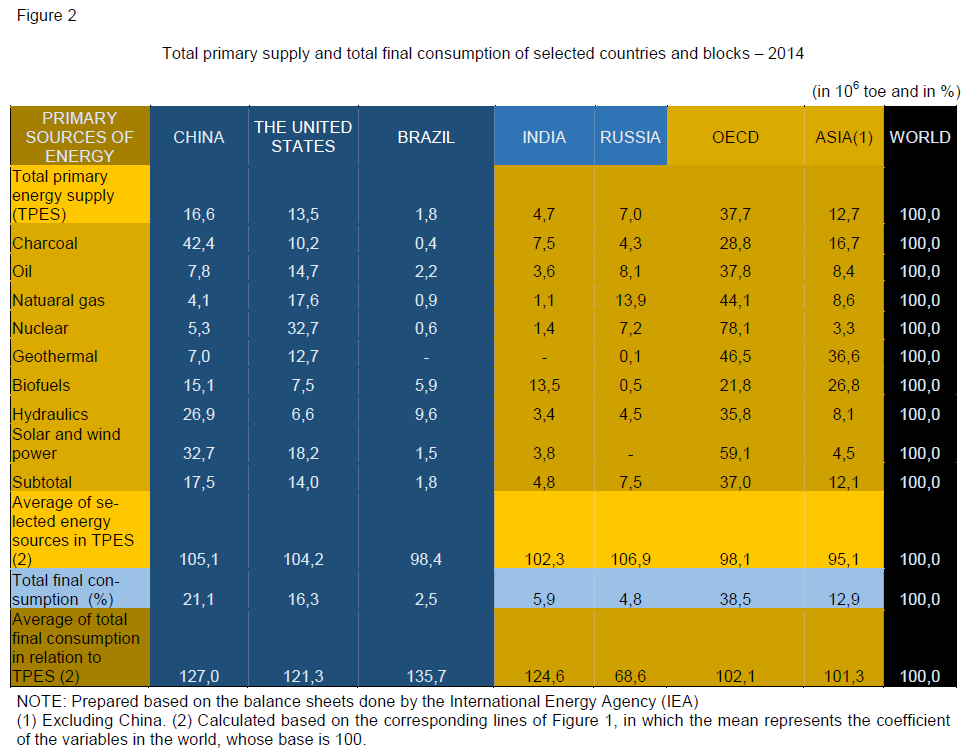
By way of illustration, the United States and China together account for 30.1% of the world TPES (16.6% for China and 13.5% for the United States), the OECD accounts for 37.7%, and Brazil, for 1.8%.

When considering the global TPES of the energetic vector highlighted, in this case, coal, China represents 42.4% of the total. On the other hand, renewable energy sources — wind and solar — from China account for 32.7%, from the United States, for 18.2%, from the OECD, for 59.1% and from Brazil, for 1.5%.

Considering the structure of these countries for the total primary supply of energy, for 2014, divided into fossils — oil, coal and natural gas — and renewable energy — biodiesel, solar, wind and hydraulic, we have (a) for fossils: 86.0% (China), 82.6% (United States), 56.4% (Brazil) and 77.0% (OECD); (b) for renewable energy: 10.9% (China), 5.8% (United States), 34.6% (Brazil) and 6.9% (OECD), which gives a clear advantage to Brazil’s energy matrix in relation to the emissions of CO2. This “photograph” of 2014 shows a clear world of fossils, notwithstanding the technological efforts in favor of renewable energy.

The CO2 emissions from the energy matrices of China, the United States, Brazil and Rio Grande do Sul

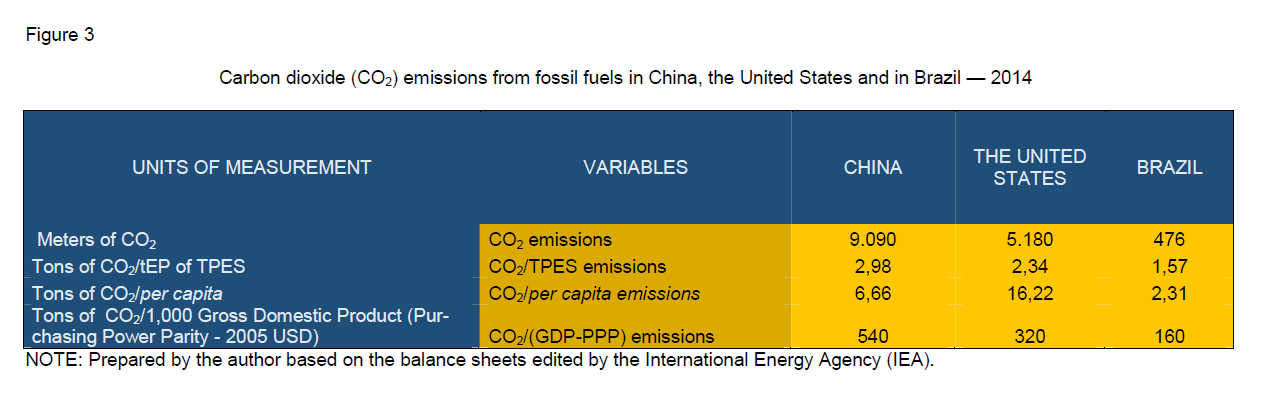
Figure 3 shows the CO2 emissions through some variables used to indicate the comparison between countries or blocks of countries, in this case, China, the United States and Brazil, revealing, for the year 2014, the significant amount of CO2 emitted by both China and the United States: 9.1 and 5.2 billion tons respectively. Meanwhile, Brazil emits 0.5 ton, a result derived from the structure of its energetic matrices in fossils and renewables, as seen in the previous item, and the magnitude of its economies. Another indicator that I consider important is the ratio of CO2 emissions per unit of purchasing power of the Gross Domestic Product (GDP) in US dollars in 2005. In other words, a unit of GDP generates 0.54 kg of CO2 for China, 0.32 kg for the United States and 0.16 kg for Brazil.


The world energy matrix is based on fossil energy (which is also true for the selected countries), despite the recent and rapid growth of wind, solar and biofuels energy. The specialized literature, in its projections for 2050, says that fossils will continue to grow at rates lower than that of the renewables, albeit with relative loss in the structure of the energy matrix. Fossils will continue to produce increasing environmental impact unless agreements, such as the COP 21, and technological progress, at a competitive cost, come to curb this trend.

Mutation point

Regardless of the position of scientists who diverge in their diagnosis, if the idea of combating global warming continues, it will catalyze a major battle between two “kingdoms”, the one of fossils (oil, gas, coal, etc.) and the one of renewable energy (water, bioenergy, wind, sun, etc.). In this battle, if the “new king” wins, it will inaugurate a new era, whose basis will result from two vectors: that of technology and that of its competitive costs. On the other hand, the resulting energy matrix would propagate in a decentralized way and would have an important role, already during the transition. It is a revolution of the ways of production, which would be totally redesigned, and human society could make an unprecedented qualitative leap. Concentrations of power would give way to the atomization of supply, but the powerful ones of the “old kingdom,” along with the war industry, will do their utmost to present themselves as a duet.


[1] The United States is withdrawing from Cop 21, which may jeopardize the results of the Convention, considering the transfer of rich countries to guarantee the initial financing from their new presidency, which can be mitigated by the federal states due to the strength of their constitutions, which are more comprehensive than the constitution of the Union, which has residual amplitude and legislates on what states do not legislate.

[2] Exergy is the maximum work that can be obtained through the most appropriate process of a system that is in an initial state until it reaches the final state, characterized by the thermodynamic equilibrium with the environment. This concept can be also defined as the maximum work potential of a substance or the minimal work done to bring the system out of its dead state. Potential and kinetic exergies are equal to potential and kinetic energies, but they are mathematically different in physical and chemical terms.

[3] This low value of efficiency of China presented here, besides the coal vector and its matrix structure, may be due to the introduction of the concept of exergy, but I tried to get around the problem by using data from the International Energy Agency.

Technological innovations in China: lessons and perspectives

In recent years, significant changes in the distribution of the production of technological innovations have been noticed around the world. Until recently, the development of the most important innovations is concentrated in the countries of the well-known Triad (US-Canada, European Union (EU) and Japan). However, other nations have been rising on the world stage of innovation, and some of the main ones are part of the BRICS — Brazil, Russia, India, China, and South Africa —, especially China. In this text, we intend to show that China has been making significant efforts in terms of investments and science and technology (S&T) policies, which not only points to possible lessons for countries such as Brazil, but also addresses the challenges of a process of technological change that may have global repercussions.

Since 1978, China has been developing a series of major reforms in the S&T sphere that has improved both higher education and research and development (R&D) activities in the country, mainly through the Central Government’s Five-Year Plans. However, that strategy of scientific and technological development underwent a major change after 2008, towards increasing the nation’s control over technology. With the outbreak of the global financial crisis in that year, China’s formidable economic growth, given the high and constant growth rates of its Gross Domestic Product (GDP), suffered a setback that had a negative impact on its economy, which was driven by industrialization and focused basically on the adaptation and imitation of traditional technologies of the developed countries. The Chinese, pressed by such situation, reacted by building their own framework for innovation and improving the competitiveness of national research institutions. Thus, innovation in China has been playing an increasingly prominent role in economy, and Chinese companies have been pursuing innovation through R&D and international partnerships.

In the context of deep changes, China has been involved in two initiatives regarding the development of S&T policies: the Five-Year Plan (2011-15) and the National Plan (2006-20). The Five-Year Plan has brought in US$1.7 trillion to several strategic sectors in technological terms, including renewable energy, biotechnology, efficient and environmentally friendly technologies, electric cars and a new generation of Information Technology (IT). On the other hand, the National Plan, of medium and long terms, aims at tackling what is perhaps China’s toughest challenge, which is to enhance the innovation capacity of its business sector.

Despite the challenges, China’s excellent performance in S&T investments in its own territory is evident. We can notice a staggering increase in R&D spending, as investments rose from just over US$41 billion in 2000 to more than US$344 billion in 2014, an eight-fold increase in the period (Figure 1). In this matter, China has already surpassed the expenditures of the European Union (28 countries) and only lags behind the United States. In addition, if the investment growth trends of China and the US remain constant, the Chinese may surpass the Americans by 2019 (projection of the Organization for Economic Co-operation and Development (OECD)).1 Also, we can stress the steadiness and the pace of growth of the Chinese investments compared to those of other developed countries and the whole EU.

It is also worth mentioning the percentage of this type of spending in relation to the GDP, although it is not the highest one among the countries analyzed (Figure 2). In fact, this relationship has grown more robustly in China, while the figures in other nations have seemed to oscillate, which happened especially between 2008 and 2012. The Chinese reached the ratio of 2% in 2013, keeping the upturn in the following year, below the average of the OECD countries (Japan, the USA, many European and other developed nations), but higher than the EU average. Although the Chinese have a R&D/GDP ratio below the EU target of 3% (as set in the Lisbon Strategy, of the European Commission, and the Europe 2020 plan), it should not be ruled out that they may reach that rate in the coming years.

Despite the positive general picture, it is important to emphasize what experts in innovation studies and policies keep reminding us: increases in R&D expenditure alone do not guarantee a greater generation of innovation, especially of the more radical type. Therefore, it is also important to analyze some attributes of the Chinese S&T policies that show a strategy that is both ambitious and visionary in terms of innovation, as well as the difficulties inherent in the process. First, the key milestones of these policies are oriented to address the most serious social challenges in China through innovation, such as food security, public health, aging and disaster prevention. Furthermore, China has been boosting inclusive innovation processes in its territory, which are for and/or (produced) by the low income population. One example is the Spark Program, which aims to promote agriculture and rural development through the access to new technologies and their training, and the S&T Program for Public Welfare, which seeks to promote the marketing of technologies that can benefit social development, both run by the S&T Ministry. Such inclusion policies may have a great impact on the Chinese economy and society, leading to the emergence of a large contingent of consumers and professionals increasingly qualified (and interested in innovating).

Secondly, we point out the geographic organization of innovation within China, where innovation poles can already be detected, some of which are of global reach. Among the main ones are the cities and their respective provinces, such as Guangdong, Beijing and Shanghai, where around 73% of the country’s patents are concentrated. This fact clearly evidences the question of the Chinese concentration of scientific and technological capacity, which is a problem in the light of a pertinent survey of economic geographers of the London School of Economics.2 The study shows that the distribution of innovation in China is driven by the forces of agglomerations (population, productive specialization and infrastructure). However, instead of generating a diffusion of technologies (which would be positive), the more developed regions induce negative effects on the development of the others.

The third and last feature is China’s commitment to developing technology within the “green” (or clean) revolution — a major technological change that is expected in the coming decades by some experts in innovation studies. The main area of “green” technology promoted in China is renewable energy (solar, wind, etc.), which is evidenced by the high investments in this area, one of the largest in the world (Graph 1). Since 2014, China has been leading the expenditures on R&D for this type of energy — in 2015 alone, more than US$100 billion (almost 36% of all global investment) were spent. Moreover, other important countries in the development of these technologies — such as Germany, Finland, France, Denmark and Norway — have also been investing, but to a lesser extent than the Chinese, while the United States and the United Kingdom have been showing a hesitant attitude towards these investments. It is noteworthy that, beyond investments, China has adopted a similar approach to that of Germany, which understands the “green” technological transformation not only in terms of technology, but also as economic and social change — green production and lifestyle —, which establishes sustainability (the control of pollution and waste) as a competitive advantage.

However, China is unlikely to accomplish a “green” technological revolution alone, especially in an increasingly globalized world. And that is worrisome in the context of a persistent global crisis, in which the United States remains faltering in R&D on clean technology, and the attention in the Eurozone is being directed to economic austerity policies and not to real solutions, which could be the way to innovation in green technologies. Brazil cannot be overlooked in this respect. Its importance becomes evident in Chart 1, which shows its strategic investments in renewable energies and its participation in the BRICS, especially with the possibility of China being a preferential partner, which depends on the next steps of Brazilian economic and technological policy.

To conclude, two issues remain unsolved regarding China’s role in a probable ongoing technological revolution. The first one is related to the problem of the lack of a competitive business environment favorable to innovation, as described previously. Some analysts indicate that one of the main pillars of this problem is the absence of risk capital and, consequently, the business environment is unfavorable for innovative startups (emerging companies in specific niche markets). This problem has its origin in the predominance of state-owned companies with little interest in innovation and, as a consequence of this, in the absence of competition between companies, which prevents the emergence of a proper environment for innovation. However, this analysis is partly misleading, because the role of the state is underestimated, as it is unfortunately a commonplace in the business sector and in the public opinion in general. An important group of researchers on innovations has demonstrated the relevance of the state as a direct and indirect inducer of the main innovations in the world, especially in the case of the United States, where major technological breakthroughs (such as those in microcomputer science) occurred in the convergence of the state with the private sector, and not with private risk capital as the encouraging force for innovation. A well-grounded discussion on this theme is found in the book The Entrepreneurial State: Debunking Public vs. Private Sector Myths, of the Italian-American economist Mariana Mazzucato, published in Brazil, in 2014.

The possible solution to this problem is to make changes in Chinese institutions and organizations to make them more flexible, which inevitably involves decentralization, a path the Chinese government has not shown any signs of following yet. This situation leads to the second issue, related to the technological role of China in the world. The history of technological change in the world shows that technological revolutions very often occur and are reinforced by some degree of social and economic inclusion of the population of their respective regions of influence (increase in the consumer market, greater qualification of the workforce, etc.). In this sense, China has shown that it is following the path of promoting inclusive innovations, that is, innovations aimed at the low-income population and/or developed by that stratum. Therefore, that is another reason for us to keep a close eye on that Asian country, which will soon take the lead of the world’s technology board.


1According to the last OECD Science, Technology and Industry Outlook 2014, a biannual OECD publication on the main trends in science, technology and innovation in the world.

2CRESCENZI, R.; RODRÍGUEZ-POSE, A.; STORPER, M. The territorial dynamics of innovation in China and India. Journal of Economic Geography, v. 12, n. 5, p. 1055-1085, 2012.

The shipbuilding and offshore industry and the Rio Grande cluster: assessment and prospects

The shipbuilding and offshore industry is a complex comprising a set of linkage activities over an extended period of time for planning (engineering and contracting) and for the assembly of a final product of high added value. Historically, for military or civilian objectives, the shipbuilding industry has a relatively low internationalization level, where, hierarchically, a great diversity of national structures, different ways of organizing the competition and all sizes of companies coexist.

Although it can be considered mature in terms of technology, the marine and offshore industry has been the subject of continuous evolution in production processes in recent decades. Most of these changes are associated with the pursuit of productivity gains related to the evolution of cutting structures and to the pre-treatment of plates, to the building blocks, to the cargo transport, to the increasing automation of several of these steps and to the expansion of the infrastructure of shipyards, bigger and further rationalized (sheds, dams, logistics for the movement and for the internal control of the shipyard, automation, etc.). Compliance with the delivery time and the quality of the final product constitute significant competitive advantages for leading shipyards and reinforce the importance of innovations in the production process[1].

The competitive investment in the naval and offshore sector — the construction of shipyards, the development of engineering and construction companies and local suppliers — requires large amounts of capital with long-term maturity and a relatively stable demand for a long term. In addition to the amortization of the investment and to the necessary capital accumulation for a typical cyclical industry, associated to trade and to global production, this continuity is important for the cumulative technological learning, both in terms of internal processes to the shipyards and in relation to the management of the production chain.

Among the major world producers, the overcoming of barriers to entry in the sector was carried out with broad and diversified stimuli and planning policy, and state productive action, and also through the use, in an initial period, of competitive advantages in the costs of raw materials such as steel and labor (cheap and skilled). These policies allowed the entry of these countries in the sector and the development of national players, stimulating the generation of high added value in a sector with ample productive and technological linkages. In addition to the macroeconomic benefits and technological development in the various stages of the production chain, we should also note the ability of the shipping industry to introduce competition in infrastructural sectors such as transport and energy. These sectors, while creating horizontal incentives, benefiting various segments through the possibility of greater organization in the transport infrastructure, also enable specific competitive advantages that leverage other accumulation strategies, such as the offshore oil producing countries’ industry.

The historical context of the shipbuilding industry can be presented through the leadership alternations over the decades, with the United States and Europe being overtaken by Japan in the twentieth century, South Korea surpassing Japan between 1980 and 1990, and China getting closer to the Korean leadership in the 2000s. Overall, the use of cheap labor matches historically with directing policies for national orders (oil, ship owners and marine), with public financing and the promotion of local businesses in all leading countries. These same features can be found in other cases, such as the shipbuilding industry of Singapore, Norway — leaders of the offshore segment — as well as in the cases of the emerging countries Vietnam and India.

In the first decade of the 2000s, which was extremely vigorous for the shipbuilding industry worldwide, the two main vectors that can be highlighted as central to the expansion of investment in this period were the positive scenario for vessels demand and for the strengthening of national policies for the development of the shipbuilding industry in a larger set of countries, especially facilitated by the growing market itself and the geographic redirection of demand. In this context, the growth of trade, the value of freight, the oil prices and the participation of developing countries in the activity, especially China, have boosted demand for vessels worldwide[2].

In Brazil, this evolution of the oil industry enabled great advances in the volume of investment and in the modernization of the national offshore production equipment industry. Recent changes in the shipping industry as well as its limitations are directly associated with the volume and profile of Petrobras’ investments and its evolution over the past few years, especially when compared to the previous decades. Institutional changes and the industrial policy of the Brazilian oil and gas industry also fulfilled a decisive role in this evolution. Thus, the 2000s in Brazil were characterized by the vigorous process of the rise of investment in exploration and production (E&P), by intensifying a strategy of driving the demand towards the domestic suppliers and by the progressive structuring of policies and institutions focused on growth and competitiveness of the offshore domestic production. Since the beginning of this period, the signaling of an increase in the amount of orders to the country was accompanied by the completion of contracts with domestic shipyards. This process, in the case of the offshore industry, also presented the expansion of local content in the bidding rounds of the National Petroleum Agency (ANP) as an important transformative element of the productive structure.

Such a scenario was responsible for a movement towards the recovery of the production capacity of the Brazilian offshore industry, which took place in parallel to the resumption of orders for tankers (and, to a lesser extent, cargo ships and container ships), stimulated by Petrobras’ Modernization and Expansion of the Fleet Program (Promef). This increase in demand was at the center of the transformation of the productive structure, which has undergone a recovery of idle structures and subsequently began a stage of expansion and consolidation, with the emergence of new players and shipyards. During this second stage, starting at the end of the first decade of the 2000s, not only were there significant improvements in terms of modernization and capacity building of local players, but new challenges have also emerged. Among them, the very rapid growth of the sector and the need to accommodate the implementation of major projects to tight deadlines.            In addition to the recovery process of the shipbuilding industry, the emergence of new shipyards, designed and built based on Petrobras orders, has been an important innovation that emerged from this recovery. The Rio Grande shipyard is an important example of the offshore industry. Its success prompted further industrial densification in its surroundings, yet at an early stage, besides the consolidated Brazilian naval and offshore industrial deconcentration. The naval and offshore cluster of Rio Grande and its surrounding area are composed of Rio Grande shipyards — ERG 1 and 2, Honorio Bicalho and Estaleiros do Brasil —, and its supply chain is one of the main actors in the recovery of the shipbuilding industry in the country.

In addition to the expansion of the production capacity, the response on the level of employment was significant. Considering only the construction activities of vessels and floating structures in Rio Grande, direct employment volume in platform manufacturing increased from an average of 111 jobs between 2006 and 2009 to 7,479 in 2014 (Figure 1).

grafico-1

As a result of this expansion, the share of manufacturing activities of other transport equipment in the total Gross Value of Production (GVP) of the state’s manufacturing industry rose from 0.8% in 2007 to about 2% in 2014. Within this sector, the construction of vessels has the largest share, increasing from 0.7% of the total GVP of Rio Grande do Sul’s manufacturing industry in 2007 to approximately 1.7% in 2014 (Figure 2).

grafico-2

The share of Rio Grande in the total GVP in the manufacturing activity of other transportation equipment of RS, obtained from the value of fiscal exits of municipalities, increased from 21.3% in 2010 to 95.1% in 2013. In this context, this activity increased from 7.4% of the total revenues of the municipality’s processing industry in 2010 to 62.2% in 2013, indicating the importance of the shipbuilding cluster for the city and for the industry of Rio Grande do Sul (Figure 3).

grafico-3

Since 2014, however, the segment as a whole and the shipbuilding and offshore cluster of Rio Grande specifically were hit by the crisis. The fall in oil prices from the middle of that year made the world reduce its demand for ships and floating structures. In Brazil, the progress of the investigations involving Petrobras produced delays in payments, investment decisions and in the expansion of production, which made it impossible or difficult for companies to operate in the sector. The consequences of this crisis were the downsizing of orders and their prices and the employment reduction in the sector. By the end of 2015, considering the peak of employed staff observed in 2013-14, the fall in direct employment in the shipbuilding sector in Brazil was 9,850 jobs, of which 1,730 in Rio Grande (Figure 4). However, if the impacts along the production chain are considered, the reduction of the employment level is much higher.

grafico-4

In addition to the fall in industrial employment, the impacts from the industry crisis have reverberated throughout the economy, as the country has an innovation system for oil production that is highly competitive in some areas. The continuity of this technological dominance in highly knowledge-intensive activities by a group of Brazilian companies would make it possible to shorten their distance in relation to countries that today are at the technology frontier. This fact shows the impact of Petrobras in the Brazilian economy. In this sense, it is important to resume the deepening of technological development and the mastery of knowledge related to the shipping industry and the oil and gas chain, whose range is not restricted to the oil industry, but it has repercussions in other areas of the economy. With the establishment of a new government in May 2016, the prospects for the sector in Brazil and for the shipbuilding cluster of Rio Grande will depend on the conditions of the international oil prices, the direction of industrial policy and the role to be played by Petrobras in this process.


[1]  RODRIGUES, F. H.; RUAS, J. A. G. Sistema produtivo 07: perspectivas do investimento em mecânica. Campinas: UNICAMP, 2009. Projeto perspectivas do investimento no Brasil. Bloco: produção. Sistema produtivo: mecânica. Documento setorial: naval. Retrieved from on Jul. 8, 2016.

[2] For more details, see AGÊNCIA BRASILEIRA DE DESENVOLVIMENTO INDUSTRIAL (ABDI). Relatório de acompanhamento setorial: equipamentos de produção de petróleo offshore (Epo): estrutura do setor e perspectivas para o Brasil. Campinas, 2012. Retrieved from < http://www.abdi.com.br/Estudo/000%20-%20neit_EPO_01.pdf > on Jul. 8, 2016.

The developing countries on Rio Grande do Sul’s trade radar: the case of agricultural machinery

It is common to analyze the insertion of the State of Rio Grande do Sul in the global economy by taking into account topics such as its exporting partners — Argentina, China and the United States, not necessarily in this order — and the traded goods — soybeans and its products, meat (beef, pork and chicken), tobacco and chemicals. Although an increase (or maintenance) in the economic flows to these destinations and in these sectors is desirable, it is convenient to explore the opportunities in countries with high potential of economic growth in the next decades: the developing or emerging markets, especially those in southern Asia and in Sub-Saharan Africa.

 Graph 1 - Share of countries and blocs in the exports of Rio Grande do Sul — 2003-14

Currently, most exports of Rio Grande do Sul are already directed to developing and emerging countries, thus following the trend of Brazilian exports, as shown in Graph 1. According to data from the Economics and Statistics Foundation (FEE), exports to the other four BRICS members (China, India, Russia and South Africa) and to the remaining Latin American countries comprised, in 2014, more than half of the state’s total exports (the proportions were 27.2% and 23.8% respectively). If other developing countries in Africa, Asia and the Middle East are considered, this proportion will certainly increase. The developed world — North America (9.2%), Europe (16.8%) and Japan (1.22%) — remains relevant, but its share has reduced over the last two decades.

Characterizing the current trade with emerging countries in general lines is a complicated task, as we can observe differing patterns for each geographical area. While soybeans and its products predominate in the commerce with East Asian partners (China, India, South Korea and Vietnam), in Africa and in bordering countries of Brazil, the export basket is more diversified. In the case of Rio Grande do Sul’s exports to Argentina, for instance, in spite of recent fluctuations and restrictions, products of medium and high added value, such as agricultural machinery, transport vehicles, industrial inputs and chemicals, are still relevant. When it comes to African and Middle East nations, other sectors are more salient, as the case of meat products to Angola (roughly US$108 million in 2014, or almost 54% of exports to that country), tobacco to Indonesia (47% of the basket to the country), and rice to Cuba (45% of the basket), according to statistics from the Brazilian Ministry of Development, Industry and Foreign Trade (MDIC).

An observation of this recent trade dynamics should not undermine the considerable potential of intensifying the trade with most emerging countries. The expectations about the broadening of agricultural frontiers in Latin America and in Africa offer, at the same time, opportunities and challenges to the insertion of the state in the global economy. African and other Latin American markets are competitors of Rio Grande do Sul as producers and exporters of soybeans and corn and also partners as importers of agricultural machinery. This may be not only a very profitable niche for the local companies and entrepreneurs, but also a convenient solution for the risk of excessive commoditization of state exports in recent times.

Graph 2 Composition of Rio Grande do Sul’s exports of agricultural machinery by destination — 2003-14

Currently, African and Latin American countries purchase 92% of Rio Grande do Sul’s exports of agricultural machinery, as can be seen in Graph 2. This figure is even more significant when we bear in mind that it was only 72% in 2005. Such process is in line with a wider movement within the Brazilian commercial policy over recent years, focused on the expansion of economic activities in emerging markets. With respect to the agricultural machinery industry, such strategy provides an additional demand for the industrial sectors of Rio Grande do Sul which have been struggling to compete in foreign markets. As the primary sector is still predominant in most of Latin America and Africa, the state’s industry may restore its share within the state’s exports.

In Africa, Ethiopia, Chad, Mozambique and Rwanda are among the top ten countries in economic growth rates in the 21st century. Unlike Angola and Nigeria, they are not rich in mineral resources and have prospered thanks to agriculture. Placed in the earliest stages of development, these nations still need machinery to expand their rural production, which represents a significant room for the economy of Rio Grande do Sul.  In fact, the Brazilian government signed an agreement in 2013 aimed at financing exports of agricultural machinery to Africa, through the Financing Program for Exports (Proex). Such measure is part of the international More Food Program, whose purpose is to promote the development of agriculture in Africa. Finally, the line of credit offered by the Brazilian National Bank for Economic and Social Development (BNDES) for exports-driven and non-agricultural products can be used by the state industry interested in exporting to Africa.

Furthermore, among Latin American countries, we highlight Bolivia and Paraguay, whose economic growth rates have been sound due to the expansion of family farming and to the advance of soybeans cultivation respectively. These processes have been influencing the state industry, which increased its sales to Bolivian and Paraguayan farmers. Concerning Paraguay, the strong presence of Brazilian-origin farmers (many of which, born in Rio Grande do Sul) strengthens the ties between the rural production in that country and the state’s industry of agricultural machinery. In addition, the increase in exports to Venezuela, despite its acute economic crisis, is probably a consequence of the accession of that country to the Southern Common Market (Mercosur), an initiative supported by many Brazilian industrial groups. Argentina has been an exception to the norm: its protectionist stance on trade, more visible after 2009, has induced a stark reduction of 56% on local sales from 2007 to 2013.

Economic and Trade promotion overseas, in contrast to the political and diplomatic relations, is not an exclusive competence of federal authorities. States and city authorities may — and are expected to — encourage local business beyond the borders of the nation. Actually, the activity of subnational governments in global economy has become more and more common, which operates, in most cases, as a complement to the national diplomatic bodies, or as a link between the latter and the business community. The forging of economic ties of Rio Grande do Sul with nations and regions traditionally underrated within the state trade outlook meets the interest of society and reinforces the current Brazilian foreign policy.